Graph of Linear Equations 3.1
3.1 GRAPHS and APPLICATIONS OF LINEAR EQUATIONS
a. Solve applied problems involving circle, bar, and line graphs.
b. Plot points associated with ordered pairs of numbers.
c. Determine the quadrant in which a point lies.
d. Find the coordinates of a point on a graph.
Objective a
Solve applied problems involving circle, bar, and line graphs.
Applications with Graphs
Circle graphs and pie charts, or charts are often used to show what percent of a whole each particular item in a group represents.
Bar graphs are convenient for showing comparisons. In every bar graph, certain categories are paired with certain numbers.
Line graphs are often used to show change over time. Certain points are plotted to represent given information. When segments are drawn to connect the points, a line graph is formed.
Objective b
Plot points associated with ordered pairs of numbers.
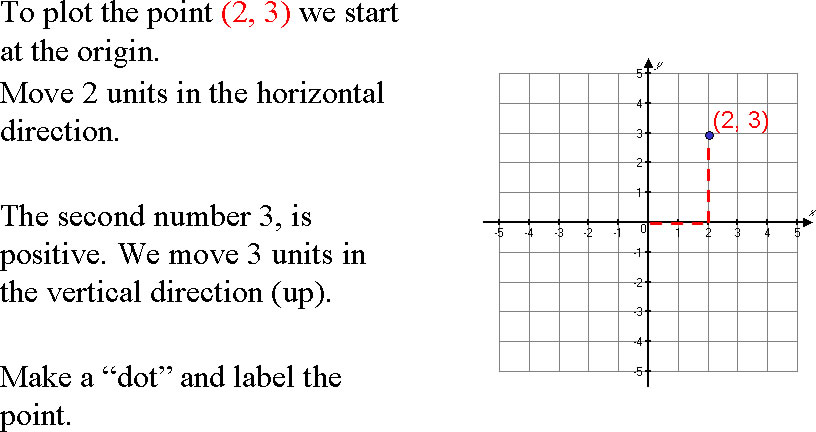
Points and Ordered Pairs
To graph, or plot, points we use two perpendicular number lines called axes. The point at which the axes cross is called the origin. Arrows on the axes indicate the positive directions.
Consider the pair (2, 3). The numbers in such a pair are called the coordinates. The first coordinate in this case is 2 and the second coordinate is 3.
Points and Ordered Pairs continued
Example A Plot the point (-4, 3).

Objective c
Determine the quadrant in which a point lies

Objective d
Find the coordinates of a point on a graph.
Example B

posted by garry @ 10:52 PM
![]()

0 Comments:
Post a Comment
Subscribe to Post Comments [Atom]
<< Home